Let’s be crystal clear about where we stand. This isn’t the time for obfuscation. We’ve divided the bull market into three stages since the pandemic lows.
The first phase (March to September 2020) was a policy-induced rally. The combined fiscal and monetary actions were unprecedented, with the global stimulus tally exceeding $20 trillion. The S&P 500 forward PE multiple jumped from 13 at the March lows to over 23, or 76 percent, offsetting a 12 percent drop in earnings for the 2020 calendar year. The S&P 500 soared 64 percent to reach its September high before falling 11 percent.
The second phase (September 2020 to December 2021) was a low-conviction rally. Labor shortages and supply chain bottlenecks were becoming more of a problem as the virus continued to spread around the world. Many were surprised by the strength of corporate earnings, which surged by 54 percent, and compensated for the multiple compression. During this period, the S&P 500 gained 50 percent, peaked on January 4, and then corrected 14 percent.
Since March 8, we believe the bull market has entered its third and perhaps final stage. This will be a high-conviction rally based on receding macro fears and rising economic optimism. Given the ongoing conflict in Ukraine and growing recession fears, this may seem inconceivable; yet, as we often say, the future is not always a reflection of the present.
Global growth optimism has sunk to an all-time low, according to the latest Bank of America fund manager survey. BofA’s strategists advise selling rallies since the correction so far is just an “appetizer” and not the “main course of 2022.”
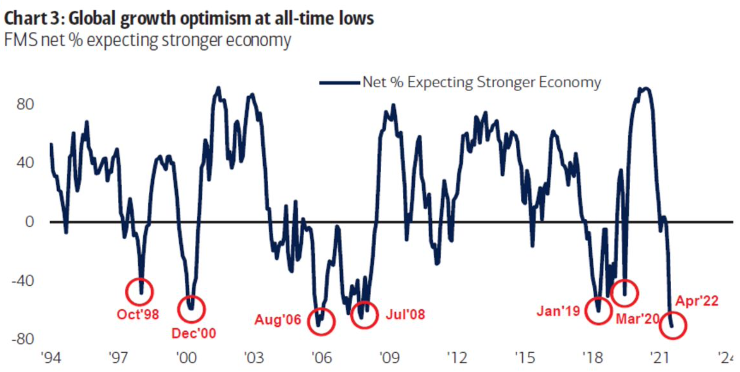
Source: Bank of America
What evidence do we have that a new bull phase has begun? We look at intermarket behavior.
Growth stocks outperform throughout the first phase, as they did, beating value by 26 percent. Value outperforms growth in the second phase, which it has by 33 percent. In the third phase, growth stocks reclaim the lead. Since March 8, value has underperformed by 3 percent. It’s only the beginning of a new trend.
Cyclical sectors like technology and consumer discretionary considerably outperform as the third phase progresses. Defensive sectors like utilities and consumer staples underperform as growth expectations improve and interest rates increase, adversely impacting bond proxies.
The technology sector outperformed the S&P 500 by 16 percent in the first phase, but in the second phase, it was more or less in pace with the market. Relative performance is now staging a comeback. In the first two phases, the consumer discretionary sector fared similarly, and it is now outperforming the S&P 500 by 3 percent.
After underperforming in the first two phases, non-US markets tend to outperform in the third. Stock markets with heavy exposure to cyclical equity sectors generate the greatest gains, including emerging markets (EM). This is what we are seeing.
Despite the war in Ukraine, France’s CAC index and Germany’s DAX index are up 12 percent and 10 percent, respectively, since March 8, compared to the S&P 500’s 6 percent return. EM stocks are up 8 percent from the lows (on March 15). Japan’s Nikkei index is up 7 percent.
EM carry trades also make a comeback as risk appetite increases. A group of currencies from emerging economies across Latin America, Asia, Europe and the Middle East and Africa region are up 6 percent since March 8. The Brazilian real has gained 9 percent, the Mexican peso has gained 7 percent, and the Australian dollar has gained 3 percent.
The dollar weakens during the third phase. The dollar index is nearing 52-week highs, but the greenback is essentially unchanged against the euro and British pound, and only rallying against the Japanese yen. Overall, the dollar’s breadth is weakening, with the advance-decline making lower highs.
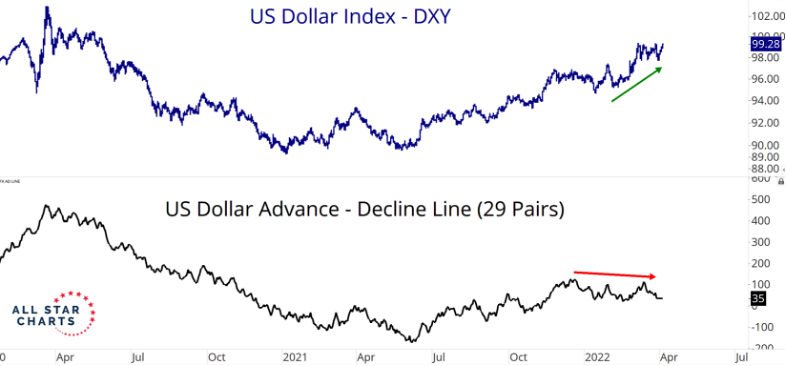
Source: All Start Charts
Government bonds significantly underperform stocks and high yield bonds during this phase. High yield bonds are down 2 percent since March 8 while long-term bonds (such as TLT) are down 11 percent. Corporate and high yield bond spreads can tighten during this phase and deliver positive returns, despite falling creditworthiness and rising defaults. We think high yield bonds are attractive.
A rise in real interest rates during the third phase is a headwind for zero-yielding commodities, which begin to lag in terms of performance. This will surprise investors, who, according to the latest Bank of America fund manager survey, are currently the largest net overweight in commodities ever.
In the last three months, commodities have risen by about 40 percent. The largest three-month gain was 42 percent in 1973. Given the historically extreme nature of the rally, commodities will take a breather. We think markets are unlikely to be rattled by another energy shock. The Bloomberg commodity index is down 5 percent since March 8.
During this third phase, we predict the S&P 500 will rally by at least 25 percent, driven by a mix of earnings growth and multiple expansion.
The first stage of valuation correction coincided with the sharp rise in bond yields. The S&P 500 price-to-earnings (PE) ratio declined from 24 times to just about 19 times. It’s conceivable that we’ll see a drop to 16.5 times (the 25-year historical average), but the path will be messy.
Monthly core inflation slowed to a 0.3 percent rise in March, following five straight increases of a half percent or more. Bond yields should stabilize now that year-over-year inflation readings are cooling off. The 10-year yield gained 100 basis points in just three months. The next 50 basis points rally could take up to a year.
As the upward pressure on yields subsides, so will the downward pressure on multiples, allowing for a 10 percent increase in the PE ratio to 21. This is not unheard of. From late-1998 to the 2000 top, the PE ratio rebounded by 15 percent, and from mid-2006 to the peak in 2007, it rebounded by 14 percent.
The next stage of valuation correction will be precipitated by a recession, which does not appear to be on the horizon. The current economic recovery is middle-aged, with the prime-age labor force participation rate yet to return to pre-pandemic levels.
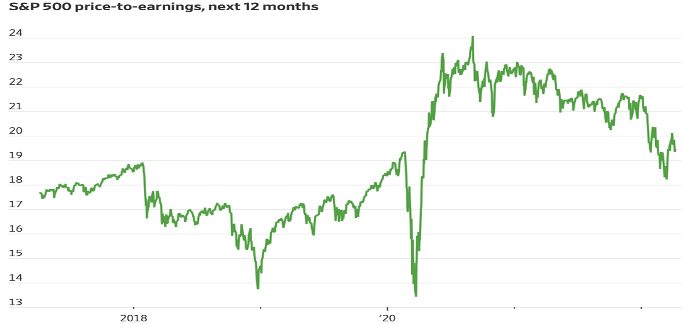
Source: The Wall Street Journal
Analysts estimate S&P 500 earnings per share (EPS) will increase 9 percent in 2022 to $227, and another 10 percent in 2023 to $250. There’s downside risk to those estimates given the high degree of uncertainty surrounding the economic outlook. Goldman reduced its EPS forecast for the S&P 500 to $221 in 2022 and $233 in 2023.
We are more optimistic. One of our core beliefs is that investors are underestimating the adeptness of the US corporate sector to protect margins and grow profitability despite wage inflation, input cost pressures, and supply-chain challenges. The combination of pricing power and productivity gains will support earnings overall. It’s hard for us to believe that we are on the cusp of a wage-price spiral.
According to Factset, actual earnings reported by S&P 500 companies have exceeded estimated earnings by 8.9 percent on average over the past five years, with 77 percent of S&P 500 companies beating estimates. The positive earnings surprise on a ten-year timeframe was 6.5 percent, with 72 percent of S&P 500 companies beating analyst estimates.
We’re thus comfortable with a $250 EPS estimate for the S&P 500 in 2023, even if earnings are downgraded. When we include a comeback in the PE ratio to 21, the S&P 500 has a target of 5,250, implying a 20 percent gain. That makes us the most bullish on the street. This isn’t something we’re used to.
We stated last month that most of the bad news has already been priced into the market, and that we are nearing the end of the correction rather than bracing for another big drop. We can now confidently declare that the third and perhaps final phase of the bull market has begun.
Onwards and upwards.