Who’s afraid of quantitative tightening? Everyone we know.
The withdrawal of liquidity, their concern goes, reverses the dynamic that supported all risk assets and will lead to sharp market declines. When the Fed last quickened the pace of its balance-sheet reduction, in October 2018, bad things happened. Also Fed chief Jerome Powell said at the time that the central bank still had “a long way” to go until rates turned neutral.
The S&P 500 tumbled 14 percent in the fourth quarter of 2018, leading to the worst equity outflow on record in both dollar and percentage terms. To experience Q4 declines of similar force you’d have to go back to the Great Depression between 1932 and 1937, or follow the attack on Pearl Harbor in 1941, or Black Monday in 1987, or the collapse of Lehman Brothers in 2008.
The 2018 fall was the second-worst ever for global stocks and bonds. The S&P 500’s PE multiple fell 20 percent, the third-biggest drop in valuations since 1991. The dollar rose 9 percent, whereas US high-yield and EM debt posted negative returns. Oil prices plunged 40 percent in the fourth quarter to $45 a barrel.
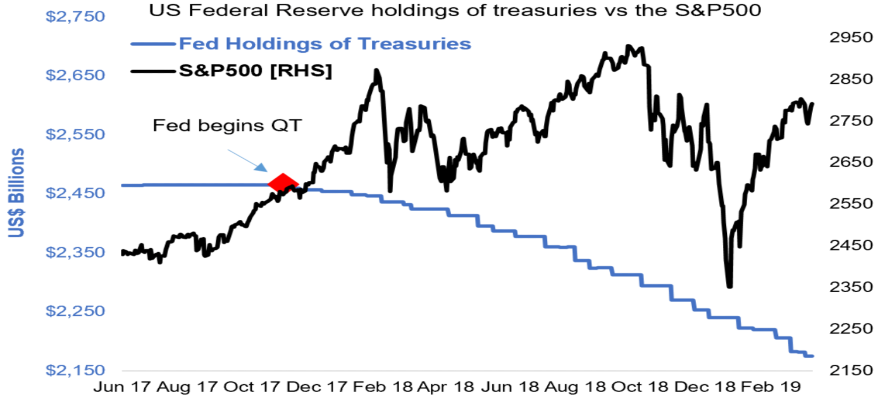
Source: Top Down Charts
According to Nobel Prize-winning psychologist Daniel Kahneman, confidence in one’s beliefs is not always a measure of the quality of evidence but of the coherence of the story that the mind constructs. “We believe we understand the past, which implies that the future should also be knowable,” he says. “But in fact, we understand the past less than we believe we do.”
While QT gets the blame for the market rout in 2018—net bond purchases by the five major central banks decreased by nearly $1 trillion—there’s a lot more to the story. Coming into that year we were bearish for a variety of other reasons. We noticed the following:
(1) The preceding year was one of the calmest periods on record for the stock market. In 2017, the worst peak-to-trough drawdown for the S&P 500 was just 2.8 percent. On 53 days the VIX closed below 10; it had done so only 9 times before in the twenty-four years of this index.
(2) An economic boom was so anticipated that the US stock market had added $6.9 trillion in market cap value since President Trump was elected. For years stocks were climbing an abnormally large wall of worry but for the first time there was no longer a litany of perceived threats.
(3) Numerous sentiment measures at multi-year highs pointed to a market peak. Bloomberg News put it best: “Waiting for an entry point in the stock market just isn’t working.” Ray Dalio, founder of Bridgewater, said “If you’re holding cash, you’re going to feel pretty stupid.”
(4) Over the three years that have followed the first rate hike, the S&P 500’s PE multiple has fallen by an average of 3.2 points. This time the PE had climbed by roughly 3 points, and by Q4 2018 it was still 2 percent above its five-year average and 15 percent over its ten-year average.
(5) As the Fed ramped up the pace of QT in October the S&P 500 was trading at an all-time high. Credit spreads were extremely tight, with US high-yield spreads at 328 basis points. Financial conditions were historically loose. The University of Michigan’s index of consumer sentiment was at 100.1.
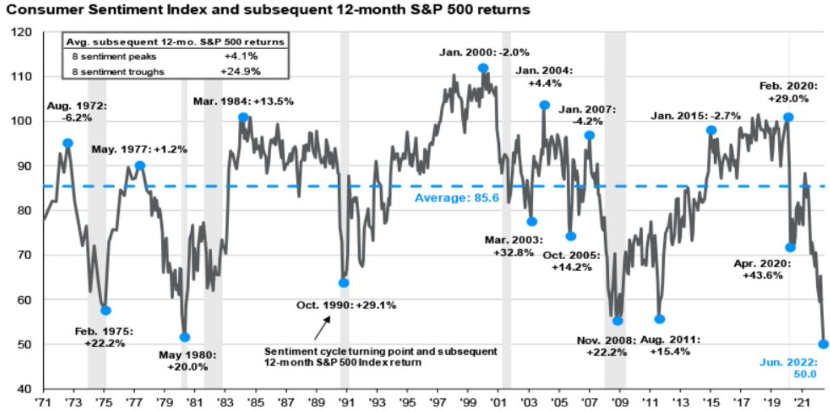
Source: J.P. Morgan Asset Management
It matters where you start. That was a precarious setup heading into the great monetary unwind. In comparison to October 2018, today couldn’t be more different.
(1) In 2021, the S&P 500 gained nearly 27 percent, notching a three-year winning streak. But the most speculative pockets of the market peaked in February 2021 and have now been in an eighteen-month bear market. The lack of a meaningful increase in implied volatility this year, despite the large market selloff, is quite unusual.
(2) An economic recession is so widely anticipated that US stocks and bonds have lost $12 trillion in value. There is a monstrous wall of worry: from a hawkish Fed, the Russia-Ukraine conflict and the energy crisis in Europe to the political flare-up in China and Taiwan and the dangers from climate change.
(3) The AAII bearish sentiment is above its historical average for the fortieth time out of the past forty-one weeks. Bridgewater’s co-CIO Greg Jensen sees stocks and bonds falling 25 percent. When asked how to invest in this market, he said that “you are not going to be able to totally avoid this.”
(4) The S&P 500’s PE multiple has dropped over 40 percent this year, almost matching the size of the contraction during the entire 2000–2002 crash. This is the fastest valuation correction in a tightening cycle. The current PE is 10 percent below its five-year average and 2 percent below its ten-year average.
(5) As the Fed’s QT reaches maximum speed with a monthly balance sheet roll-off of $95 billion, the S&P 500 is off 18 percent from the highs, and US high-yield spreads are above 500 basis points. This time the University of Michigan’s consumer sentiment index hit a record low of 50.2, and it is now back up to 58.2.
Fed policy works through financial conditions so any loosening of them—via rising stock prices or narrowing bond spreads—may be seen as incompatible with the Fed’s goals to combat inflation. In the Jackson Hole speech, Powell warned that “some pain” is on the horizon. So why fight the Fed?
A common assertion is that markets won’t bottom out until we see clear signs of a dovish central bank pivot. We disagree with this.

Source: Axios
The last aggressive tightening cycle geared to control inflation by breaking the economy’s momentum began in February 1994 and saw the Fed abruptly double its main policy rate to 6 percent in a year. The S&P 500 bottomed out in April—before the first 50-basis-point rate hike. It never went lower that year despite the 225 basis points of interest rate hikes still to come.
Then-Fed chair Alan Greenspan supported higher interest rates because he “very consciously and purposely tried to break the bubble and upset the markets in order to break the cocoon of capital gains speculation.”
Yet the S&P 500 was back near previous highs at the time of the final rate hike in February 1995. And by the time the Fed cut the main interest rate to 5.75 percent in July of the same year to stave off a possible recession, the S&P 500 was up 28 percent from the April low.
Markets are anticipatory in nature; we believe they already bottomed out on June 16. Despite a more hawkish Fed, stocks have held up well. And lower inflation prints going forward will provide a clear signal that tightening risks are receding. By the time the Fed pauses its rate hikes, which is most probable in late 2022 or early 2023, what if risk assets are much higher? Investors will be obliged to give chase.
Remember that we’re not just living through an extraordinary inflationary period; it goes hand in hand with highly elevated nominal growth. A recession in an inflationary environment doesn’t matter that much. Given that corporate earnings are nominal, higher inflation will be enough to grow earnings. Let that sink in.
It wasn’t like that for the last forty years. With inflation averaging about 2 percent, a recession would result in negative real growth, low or non-existent nominal growth and a concomitant decline in earnings, leading to lower stock prices. Any downturn that happens now may be different. Go on, pick a fight.