Milton Friedman deserves the most credit of any economist for cementing idea that money growth and business cycles are linked.
Examining the data back to 1867, Friedman saw money growth hit its peak and troughs just before output and employment. A moderate decline in money growth presaged mild recessions, while deeper monetary contractions portended severe depressions.
Following the 1963 publication of his results in A Monetary History of the United States, which he wrote with Anna Schwartz, the Fed started paying closer attention to monetary aggregates, particularly M1, which is made up of checking account balances and hard cash.
Because of a legal restriction on paying interest on checking accounts at the time, consumers were unlikely to put savings into them. This created a reasonably close connection between M1 and transaction balances in the economy.
Once the restriction on interest was lifted, households and firms had little reason to distinguish between keeping money in savings accounts (held outside of M1) or checking accounts (held inside of M1). Thus, the strong link between M1 and economy-wide spending started to break down. “I’m baffled,” Friedman confessed.
The Fed downgraded M1 in 1987 and turned its attention toward the broader monetary aggregates like M2, which includes M1 plus small time deposits and other instruments such as money market mutual funds that are relatively liquid.
It was a week substitute. Financial innovation and deregulation eroded M2’s status as an economic signal. Substantial swings in the monetary aggregate’s growth rate had little to do with near-term spending plans of households and firms. As a result, the relationship between M2 and GDP changed noticeably.
The correlation between real M2 growth rates and real annual GDP growth rates was 0.56 between 1960 and 1990 and –0.43 after that. When the first three decades of positive co-movement and the last three decades of negative co-movement are combined, the correlation for the entire period is almost zero.
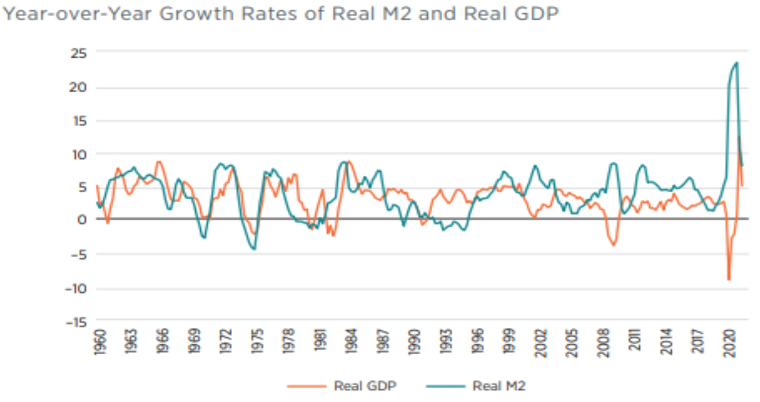
Source: St. Louis Fed
In July 1993, Fed chair Alan Greenspan informed Congress that M2 had been “downgraded as a reliable indicator of financial conditions in the economy.” Many economists concluded that short-term interest rates bear a closer connection to key macroeconomic variables.
In September 1998, the Fed initiated the practice, which it continues to this day, of announcing an explicit target for the federal funds rate immediately after each meeting. And in June 2000, the Fed stopped announcing target ranges for money growth.
Friedman believed that M2 growth in the range of 4 to 6 percent was consistent with a healthy economy. But thanks to the Fed’s bond-buying program, government stimulus checks, and extension of generous business loans, M2 grew at annualized rates exceeding 20 percent throughout much of 2020. By February 2021, M2 was a stunning 27 percent above its level a year earlier.
Republican US Senator John Kennedy questioned Fed chair Jerome Powell about it during his semiannual monetary policy report to Congress in 2021. “When you and I studied economics a million years ago,” Powell responded, “M2 and monetary aggregates seemed to have a relationship to economic growth. Right now M2 does not really have important implications. It is something we have to unlearn, I guess.”
Powell isn’t worried that M2 has fallen 4.6 percent over the last twelve months, the largest year-over-year decline on record. Money supply is contracting at a three-month annualized rate of minus 9.7 percent, although it is still $5.3 trillion higher than pre-pandemic levels at about $21 trillion.
Do we need Milton Friedman for this? Or are we confident in our analysis that money supply is divorced from prosperity and recession enough that it’s time for new ideas?
We are open to suggestions.