We are reversing our bullish bond view. We believe yields will breakout higher.
The big picture: Annual headline inflation has dropped from 9.1 percent last summer to 3.0 percent, the upper end of the Fed’s target. In the past three months, core inflation rose at a 4.1 percent annualized pace—down almost a full percentage point from May.
There’s more downside ahead as we await the slowdown in shelter costs making its way into the inflation calculation.
Our concern: Even though we disagree with the conventional narrative that significantly higher unemployment is required to tame inflation, it doesn’t matter what we think.
The Fed’s chair Jerome Powell stated that there is still “a long way to go” in the fight against inflation. One or two rate rises lie ahead before the year is out. Are we underappreciating the Fed’s commitment to get inflation back to 2 percent?
Why it matters: Reviewing past monetary-tightening cycles, we observe that the 10-year Treasury yield and the Fed funds rate have peaked around the same level.
In 1989, the 10-year yield was constrained by a funds rate near 9 percent. In 2000, the 10-year yield and the funds rate peaked at 6.5 percent. In 2006, both topped together at around 5 percent. In 2018, FOMC members’ long-run estimate for the funds rate was 3 percent. This capped the 10-year yield at 3.25 percent.
The exception was in 1994 when bond yields spiked to 8 percent in response to the Fed’s shock tightening. Then Fed chief Alan Greenspan doubled the funds rate from 3 percent to 6 percent in a year’s time, a move that was not built into market expectations.
If history repeats itself, and there’s no reason to expect it won’t, the US 10-year yield will surpass 5 percent in the year ahead. The Fed’s terminal rate has been revised up to 5.6 percent.
Question: What will drive bond yields higher? We have a few ideas.
One: What if the recession is over? Housing is recovering, manufacturing is bottoming, and the US economy is growing steadily despite higher interest rates.
The NAHB Housing Market Index rose for a seventh straight month as a shortage of existing US homes is boosting demand for new ones. New home sales rose 24 percent over last year despite mortgage rates sitting at 7 percent. Construction employment is growing briskly, and shares of home builders are soaring.
While the ISM manufacturing index has been in contraction territory for eight months, there are signs of a potential bottoming in activity. New orders improved from the lowest levels of this cycle and inventories have reached 'too low' territory, a positive sign for future production. Global freight volumes show signs of having bottomed out in the first quarter, signaling the industrial cycle may be near its trough.
Meanwhile, income and spending data suggest that the services economy remains robust. Corporate executives aren’t expecting a major slump in demand in the coming months. The NFIB’s Small Business Optimism Index ticked up in June to the highest level so far this year.
As we wrote, the interest rate sensitivity of the US economy is historically low. Consumer data shows that delinquencies on auto loans, credit cards and mortgages have improved over recent months.
We are in a period similar to the ten recessions that occurred between 1950 and 2007, which saw manufacturing contract but services continue to expand. If the recession is over and we are in the early recovery phase of the economic cycle, risk appetite will improve and the stock-to-bond ratio will rise.
Two: What if the term premium reverts to normal levels?
According to a Fed model, term premia averaged about 1.56 percentage points since 1961. But it spent much of the time between late 2014 and early 2021 below zero. The Fed’s QE program is expected to have reduced the term premium by 100 basis points.
So would 0.50 percent be considered fairly normal? The term premium that 10-year Treasury bonds offer today is -0.17 percent, compared to 0.49 a year ago. This does not seem sustainable given the troubling US fiscal trajectory.
The CBO expects cumulative budget deficits of $18.8 trillion over the coming decade. In the next three months alone, the US Treasury must sell more than $1 trillion to rebuild its cash buffers after the latest debt-ceiling drama.
Higher budget deficits have historically been associated with term-premium widening. The CDS value on US treasuries is still higher than any time over the last decade.
Three: What if Japan scraps its yield-curve control policy?
Japan has seen a burst of inflation. Kazuo Ueda, the new head of the Bank of Japan, said that if the central bank becomes reasonably confident that core inflation will rise on a more sustained basis then “that would be a good reason for a policy change.”
If the Bank of Japan exits the yield-curve control policy or even widens the band at which it allows long-term interest rates to move around its zero percent target, there could be a sell-off in US bonds.
Higher yields will encourage Japanese investors to increase their allocation to domestic bonds at the expense of foreign investments. Japan is the world’s largest net creditor and remains the largest non-US holder of Treasuries with $1.1 trillion.
Four: What if we see the full consequences of QT?
The Fed’s liquidity injections following the regional bank crisis in March expanded the balance sheet. The Treasury was also limiting sales of bills while it was constrained by the debt-limit standoff. Both dynamics have largely dissipated.
Powell told lawmakers he’s “very conscious” of the importance of not just inflating the balance sheet during each easing cycle and leaving it enlarged. The Fed is currently shedding its bond holdings at an annual pace of roughly $1 trillion.
If buying Treasuries lowers long-term rates, shouldn’t the absence of a buyer cause rates to rise? What if the US fixed income markets experience a major supply-demand disruption? Shouldn’t yields be higher given the US government’s sharply higher funding needs?
Five: What if inflation stops falling?
Annual inflation has now declined twelve months in a row, and yet the US 5-year, 10-year, and 30-year yields are unchanged from ten months ago. This is despite persistent recession worries and two of the largest bank failures in US history.
The favorable base effects will start to fade just as the Fed ends its tightening cycle later this year. What if inflation data switches from a tailwind to a headwind for bonds again? Energy prices are resurgent once more with prices at the pump at their highest in three months.
What if we see more upside than downside growth surprises? How will bond yields behave if the ISM manufacturing index jumps above 50? We think it’s likely to happen. And if we are in a fiscal super cycle, won’t interest rates remain higher for longer to combat inflation?
The committee does not see inflation reaching 2 percent until around 2025.
Get smart: Bonds are expensive.
Suppose the Fed’s aiming for a real neutral rate of 2 percent, inflation averages 2.5 percent and the term premium is 0.5 percent. In sum, this suggests a 10-year yield of 5 percent.
What to watch: The 10-year yield broke out above the 1981 downtrend line, and is now back testing and consolidating above the top rail. Support comes in at 3.25 percent (key levels from the 2013 and 2018 highs and 2003 low) with an upside target of 5.25 percent.
For TLT, the popular bond ETF, we see resistance at 106, marking the end of wave 4 according to the Elliott Wave principle. A fifth and final wave down to 85 would come next. This is how we see it.
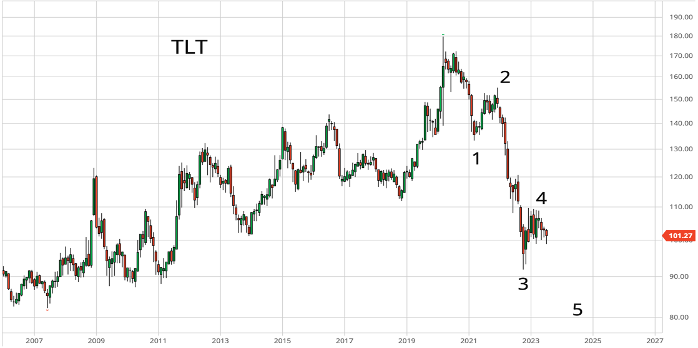
Source: barchart.com