“The market is like a beautiful woman,” writes George Goodman in The Money Game, “endlessly fascinating, endlessly complex, always changing, always mystifying. Then, if you have observed her a long time, you begin to see little tricks, little nervous movements of the hands when she is being false.”
With a description like that, how could anyone not be attracted to markets? It’s why old school macro investors like Bruce Kovner, Stanley Druckenmiller and Paul Tudor Jones have all studied charts to complement their investment decision making.
Kovner believes that technical analysis captures the voice of the entire market and thus picks up unusual behavior.
“It is very important for me to study the details of price action to see if I can observe something about how everybody is voting,” Kovner confided to Jack Schwager for his book Market Wizards. “Studying the charts is absolutely critical and alerts me to existing disequilibria and potential changes. You want to know everything you can about the market to give you an edge.”
Druckenmiller focuses on liquidity and technical analysis to time the market. “Valuation only tells me how far the market can go once a catalyst enters the picture to change the market direction,” he said. “The catalyst is liquidity, and hopefully my technical analysis will pick it up.”
Paul Tudor Jones credits the Elliott Wave approach with a large portion of his success since it allowed him to predict and profit from the 1987 stock market crash.
“You cannot rely solely on fundamentals; you have to be a tape reader, which is something of a lost art form,” Jones professed. “These days, there are many more deep intellectuals in the business, and that, coupled with the explosion of information on the internet, creates an illusion that there is an explanation for everything and that the primary task is simply to find that explanation.”
Charting is therefore at the bottom of the study list for many of the younger generation, according to Jones, particularly because the skill often requires people to close their eyes and trust price action.
When we rigidly adopt a view on the market’s direction, it becomes difficult to maintain an objective investment stance. This happens all the time. We are reluctant to let go of strongly held beliefs. Everywhere we look, confirmation bias is pervasive, investors choosing evidence that supports their preconceptions over that which contradicts them.
We rely on technical analysis for risk control and price trend discipline. A change in the technical picture gives us second thoughts and forces us to re-evaluate our investment thesis. It puts our emotions and ego in check. Instead of being tied down by prior decisions, we can simply go with what is rather than insist on how the market ought to be.
Here are some beautiful charts we are observing:
In July, we warned that TLT, the popular bond ETF, will soon begin a final wave down according to the Elliott Wave principle. The minimum fifth wave objective has been met with TLT reaching the wider support zone around 85. Keep in mind Treasuries will suffer their third straight yearly loss in 2023. There probably won’t be a fourth.
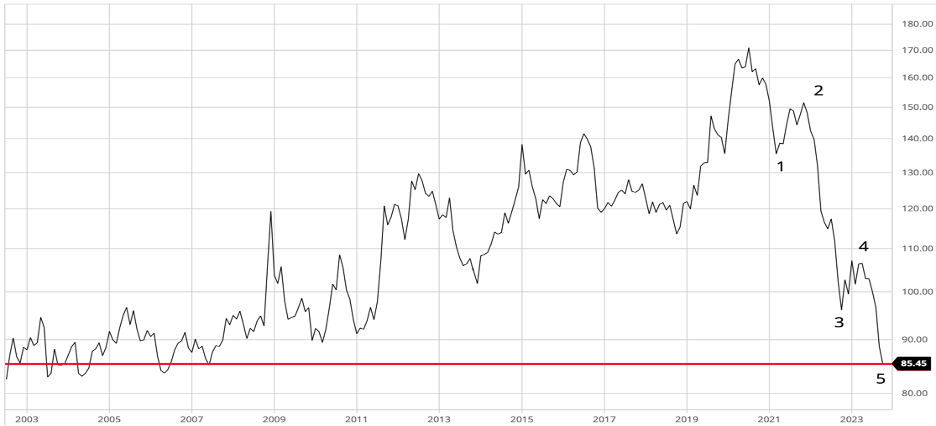
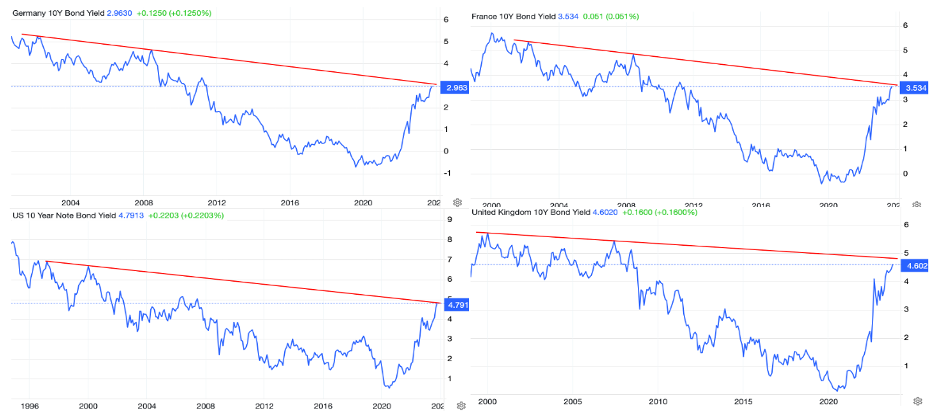
We are simultaneously approaching 25-year resistance levels for 10-year yields in the US, UK, France and Germany. With inflation downshifting and central bank tightening cycles coming to an end, we suspect bond yields will now transition to a sideways range. This will help stocks recover.
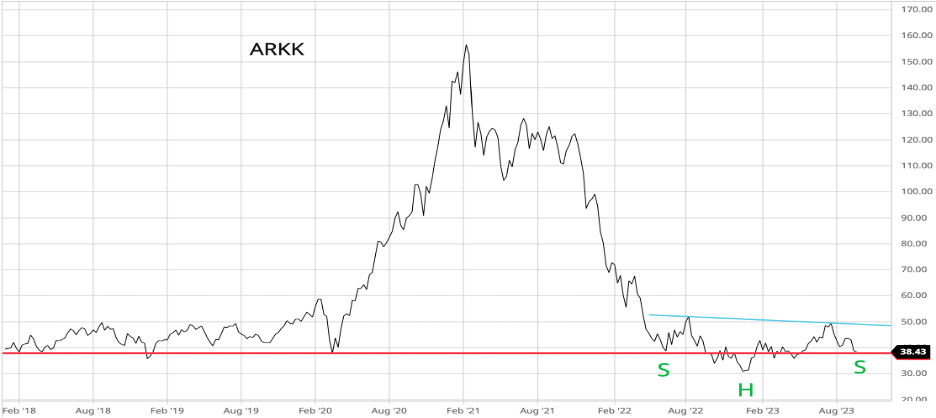
We have anticipated that Ark Innovation Fund (ARKK) will hit $60 a share before the bull market is over. This is testing our patience. Nevertheless, we observe that a bullish inverse head-and-shoulders pattern is forming on the chart despite the scathing criticism levelled against Cathie Woods. A break below $37 would alarm us.
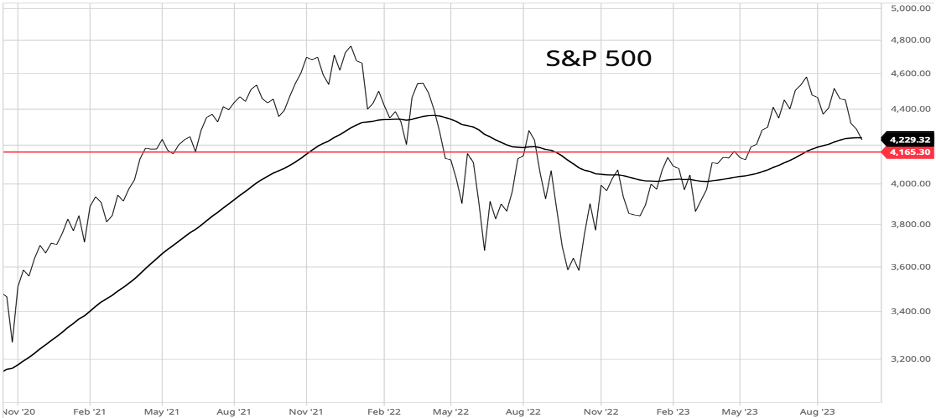
The S&P 500 has retraced to the 50-week moving average, a normal occurrence during a bull market. Horizontal support comes in a bit lower around 4,170. Only if we failed to hold that level would we be forced to adopt a defensive posture.
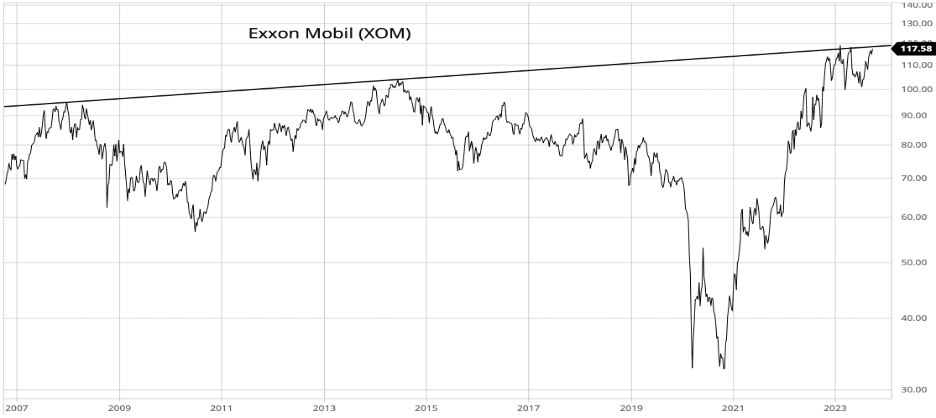
When a stock doesn’t get anywhere after a strong rise, but churns around at the same price level, the chartists call it an area of resistance. Exxon Mobil’s (XOM) $120 level is crucial since a trendline also connects there to the 2007 and 2014 highs.
If this level holds, our default assumption, it suggest that oil prices will remain contained and won’t pose a problem for growth or inflation. That’s good for stocks and perhaps even bonds. A sustained breakout would imply uncomfortably higher oil prices.
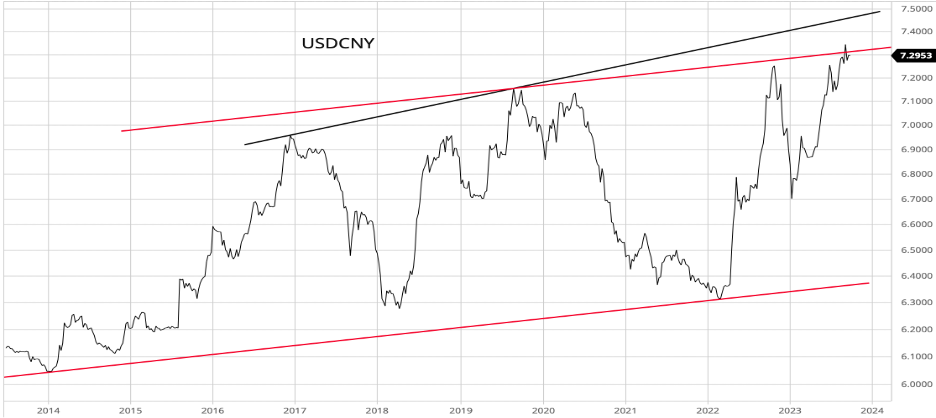
At 7.3, USDCNY may have already hit its peak. A more reasonable target is near the 7.5 level, which connects the 2017 and 2019 highs. Once that is reached, it would mark the end of the dollar rally in our opinion.
Despite the focus on the dollar’s recent surge, it’s important to remember that this is still a counter trend rally from its 2022 top. We don’t see the dollar index above 108, which would place it 6 percent below last year’s high.
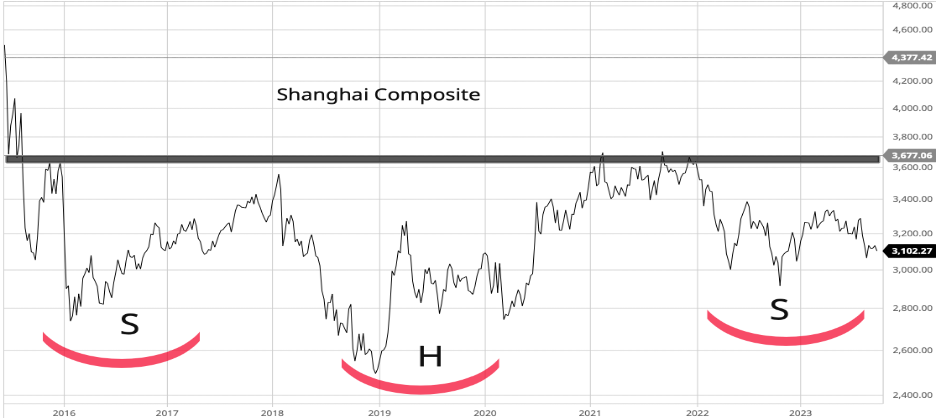
While a crisis of confidence is gripping China’s economy, the Shanghai Composite index is developing a multi-year inverse head-and-shoulders pattern. Instead of the news, we choose to follow price action. A decline below 3,000 would temporarily invalidate our positive thesis since it would allow for a drop to 2,800.
What important charts and levels are you keeping an eye on?